Every year, thousands of people report seeing something in the sky they can't explain. But how many, exactly? Looking closely at UFO sightings statistics by year reveals patterns that are more about human behavior than they are about anything actually flying overhead.
Numbers can be persuasive, sometimes more persuasive than they should be. A chart showing a sharp rise in reports looks dramatic, but the real story behind that rise is often much more mundane than it appears at first glance, which is exactly why it's worth digging into where the data actually comes from before drawing any conclusions.
It's a bit like tracking gym attendance right after New Year's: the spike is real, the underlying trend it suggests, that everyone is suddenly far more active than usual, usually is not. Reading UFO statistics carefully means learning to spot the difference between a genuine shift and a temporary spike in attention.
Where the Numbers Come From
Most public UFO statistics come from civilian databases like the National UFO Reporting Center (NUFORC), which has logged sighting reports since the 1970s. These numbers are separate from official government data collected by agencies like AARO, which mostly track reports from pilots and military personnel rather than the general public.
Sightings Rise and Fall With the News Cycle
One of the clearest patterns in the data is that reports spike sharply whenever UFOs are in the news. When a major documentary, viral video, or government hearing gets attention, reports to civilian databases jump within days, even though nothing about the actual sky has changed. This is sometimes called "reporting bias": people are more likely to notice, remember, and report something when the topic is fresh in their mind.
Seasonal Patterns Too
Reports also tend to rise in the summer months, simply because more people are outside at night, looking up, during warm weather. Winter months in most regions see noticeably fewer reports, not because fewer strange things are happening, but because fewer people are outdoors after dark.
What Percentage of Cases Get Explained?
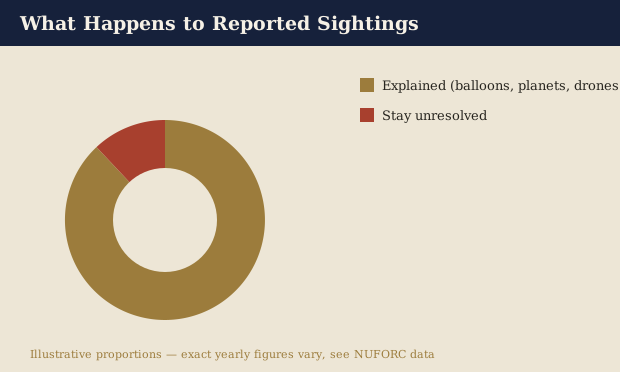
Across most large datasets, investigators are able to explain the large majority of reported sightings, tracing them back to aircraft, drones, satellites, bright planets like Venus, weather balloons, or camera artifacts. A smaller share, usually estimated in the range of a few percent, remains unexplained even after investigation. That leftover percentage is small in relative terms but still adds up to a meaningful number of individual cases each year, given how many total reports come in. We explain exactly how these explained cases get identified in our article on UFO sightings that were later explained.
Do Certain Locations Report More Often?
Yes. Reports cluster more heavily near military bases, airports, and areas with a lot of aircraft testing activity, which makes sense given how much more there is in the sky to potentially misidentify. We cover this pattern in detail in our article on UFO sightings near military bases.
How Government Data Differs From Civilian Data
Government statistics, like those AARO compiles, tend to show a smaller number of total reports but a higher percentage that remain genuinely unresolved, since these come from trained observers using proper radar and sensor equipment rather than a casual glance out a car window. This is part of the broader shift explained in our article on the UAP vs UFO difference.
How Reporting Differs Around the World
Countries with an active, well-known civilian reporting system, like the United States, naturally show higher raw report numbers than countries without one, simply because reporting is easier and more culturally normalized. This doesn't necessarily mean fewer strange things are seen elsewhere; it more likely reflects differences in reporting infrastructure and public awareness of where to submit a report.
What a Typical Year of Data Looks Like
In a fairly typical recent year, civilian databases log several thousand individual reports across the United States alone. Of these, the large majority are closed out with a probable explanation within weeks or months: aircraft, drones, planets, and lanterns account for the bulk of cases. A small percentage, often in the low single digits as a share of the total, remain open due to insufficient detail or genuinely puzzling characteristics. Government datasets, which include fewer total reports but more sensor-backed cases, tend to show a higher proportion of genuinely unresolved reports for exactly the reasons discussed in our article on what AARO stands for.
Frequently Asked Questions
Are UFO sightings increasing every year?
Raw report numbers have generally trended upward over recent decades, largely due to smartphones, easier online reporting, and increased media coverage, rather than necessarily reflecting more actual unexplained activity.
Where can I see the raw sighting data myself?
Organizations like NUFORC publish searchable public databases online, allowing anyone to review individual case reports directly.
Do sightings spike around specific holidays?
Yes, reports of orange lantern-style lights notably spike around New Year celebrations and other festivals where releasing lanterns is a common tradition.
A Simple Checklist Before Trusting a Statistic
Before accepting any UFO statistic at face value, check three things: is it measuring raw reports or verified cases, does it separate civilian data from government data, and does the source link back to the original database rather than just repeating another article's summary. This quick habit filters out most misleading headlines almost instantly.
Reading the Numbers With a Level Head
Statistics on this topic are genuinely useful, but only when read carefully. A rising number of reports usually says more about reporting habits, media coverage, and available technology than it does about anything actually changing in the sky above us. Keeping that in mind is the single best habit for interpreting any UFO sightings statistics by year chart you come across.
Explore More Data-Driven Pages
If you're building your own picture of the evidence, our timeline of UFO sightings by decade puts these yearly statistics into a much longer historical context.